
Hyperglycosylation is a metabolic driver of Alzheimer’s disease
d, Violin plots representing quantitative glycan analysis of two specific glycans (1,688 m/z and 1,409 m/z) in grey matter across Braak stages. UDP-GlcNAc functions as the shared substrate for multiple biosynthetic pathways, including N-glycosylation, O-GlcNAcylation and hyaluronic acid production (Extended Data Fig. b, The experimental design for 8-month-old 5xFAD mice injected with shScr or shPGM3 and tested for social memory 2 weeks later. c, The experimental design for 5xFAD mice treated with vehicle or NGI-1 and tested for social memory 2 weeks later. e, Social memory performance across four trials demonstrating impaired memory in glucosamine-treated 5xFAD mice (n = 6 animals) relative to vehicle-treated 5xFAD mice (n = 7 animals).
Hyperglycosylation in human AD specimens
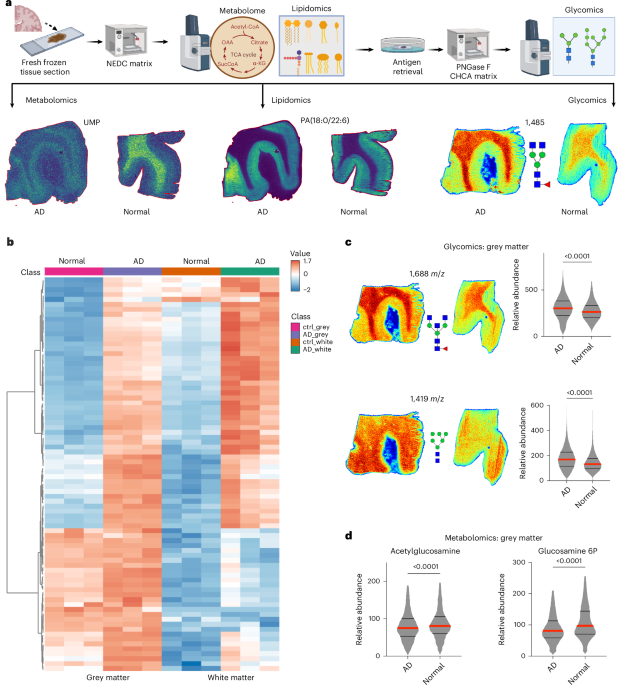
Recent advances include a multiplexed matrix-assisted laser desorption ionization (MALDI)–mass spectrometry imaging (MSI) approach to conduct spatial metabolomics, lipidomics and glycomics on a single mouse brain tissue section30. We applied this methodology to human AD brain samples. When comparing normal and AD human brain tissues, we observed markedly low glycan signal intensity with poor spatial resolution (Supplementary Fig. 1). Notably, lipid content remained elevated in human samples even following Carnoy’s solution treatment (ethanol, acetic acid and chloroform in a 60%:30%:10% ratio), a protocol conventionally sufficient for lipid removal in mouse brain tissue and widely utilized in MALDI-based analyses33. To enhance spatial N-glycome detection, we investigated alternative lipid extraction methodologies to improve glycan signal recovery in human brain specimens. We implemented an optimized xylene wash protocol (1-h washes, repeated three times), which proved to be the most effective lipid removal method and significantly enhanced glycan signal intensity (Supplementary Fig. 1a–c). Sequential MALDI imaging across multiomics datasets confirmed that this approach facilitated robust spatial glycomics analysis, allowing for a more comprehensive assessment of glycan distribution with a 10–20-fold increase in glycan intensities in AD and control tissues (Supplementary Fig. 1b,c). Using this optimized multiomics workflow, we performed spatial metabolomics, lipidomics and glycomics in a cohort of human frontal cortex samples from healthy controls and patients with AD (n = 3 each), matched for age, sex and post-mortem interval (PMI; Fig. 1a). Metabolomics and lipidomics analyses revealed specific AD-associated molecular alterations, including both upregulated and downregulated species (Supplementary Figs. 2 and 3). However, spatial glycomics analysis uncovered a particularly striking pattern: glycan abundance was dramatically elevated across both white and grey matter regions in AD samples (Fig. 1b and Supplementary Fig. 4). Further, both bisecting (1,688 m/z) and high mannose (1,419, 1,581 and 1,905 m/z) glycans are elevated in the grey matter region of the AD brain (Fig. 1c, Supplementary Fig. 4). Additional spatial metabolomics analysis revealed a significant reduction in N-acetylglucosamine and glucosamine-6-phosphate, both critical precursors in N-glycan biosynthesis (Fig. 1d). The unexpected and widespread increase in glycosylation underscores the need for mechanistic studies to elucidate the biochemical pathways driving this altered glycan profile and its implications in AD pathology.
Fig. 1: Spatial multiomics analysis reveals hyperglycosylation in human AD brains. The alternative text for this image may have been generated using AI. Full size image a, A schematic overview of the multiplexed MSI workflow utilized for integrated spatial metabolomics, lipidomics and glycomics from human brain tissue sections. Representative images for metabolite (UMP), lipid (PA(18:0/22:6)) and glycan (m/z 1,485) distributions in AD and normal control brains are shown. b, A heat map illustrating the differential abundance of glycan species identified by spatial glycomics analysis, comparing grey and white matter regions from control (ctrl; normal) and AD brain specimens (n = 3, each). Hierarchical clustering is performed on glycan species only not on samples. c, Spatial glycomics visualization and quantification of representative N-glycan species (1,688 m/z and 1,419 m/z) in grey matter regions. The violin plots show significantly increased abundance of these glycans in AD relative to normal controls. Statistical analysis was performed using two-tailed t-tests (n > 2,000 pixels per group); exact P values are indicated. d, Spatial metabolomics analysis in grey matter regions reveals a significant reduction in key glycan precursors, acetylglucosamine and glucosamine-6-phosphate, in AD compared with control samples. Violin plots present relative abundances; statistical significance assessed by two-tailed t-tests (n > 2,000 pixels per group); exact P values are indicated. Panel a created in BioRender. Sun, R. https://biorender.com/0c7yclk (2026). Source data.
To investigate the mechanistic basis of hyperglycosylation in AD, we first sought to validate this phenotype in a broader cohort of human AD specimens. We assembled an additional set of AD patient samples, ensuring matched controls for age and PMI, while stratifying individuals by Braak staging (Fig. 2a,b). This stratification allowed us to assess whether hyperglycosylation follows a temporally regulated trajectory throughout disease progression. We utilized formalin-fixed, paraffin-embedded (FFPE) patient samples (Fig. 2a). Spatial glycomics workflows incorporating PNGase-mediated glycan release and MALDI–MSI enabled the quantification of regional glycan distribution matched to histological annotation (Fig. 2a,b). Analysis of glycosylation in both grey and white matter revealed distinct patterns of stage-dependent alterations. In grey matter, a heat map of glycan abundance demonstrated a progressive increase in glycosylation across Braak stages, with the most pronounced changes observed in later stages (Fig. 2c). Violin plots of glycan structures at 1,688 m/z and 1,409 m/z further illustrated these trends, with a steady increase in glycosylation across Braak stages (Fig. 2d). Spatial heat maps confirmed these findings, showing localized glycan accumulation patterns that intensified with AD pathology (Fig. 2e). White matter glycosylation exhibited a different pattern, with glycan abundance increasing at Braak stages 1–2 but not persisting through later stages (Extended Data Fig. 1a). A heat map of glycan abundance highlighted this transient elevation, suggesting that hyperglycosylation in white matter may be an early but non-progressive event. Violin plots of glycan structures at 1,079 m/z and 1,905 m/z indicated an early stage rise in white matter glycosylation without sustained accumulation at later stages (Extended Data Fig. 1b,c). These findings suggest that hyperglycosylation in grey matter is more progressive and associated with AD severity. These results validate the translational impact of the hyperglycosylation phenotype and suggest implicated N-glycan modifications as a potential driver of AD pathology. The next critical step is to delineate the metabolic mechanisms underlying this phenotype.
Fig. 2: Progressive hyperglycosylation across Braak stages in human AD. The alternative text for this image may have been generated using AI. Full size image a, A schematic illustrating the workflow for spatial glycomics using FFPE human brain samples, incorporating PNGase treatment followed by CHCA matrix application for MALDI imaging. b, Representative histological sections indicating anatomical delineation of grey and white matter regions from human brain tissues stratified by Braak stages (0, 1–2, 3–4 and 5–6). c, A heat map displaying hierarchical clustering of glycan abundance specifically in grey matter regions across Braak stages, illustrating progressive glycan accumulation correlated with advancing disease severity. d, Violin plots representing quantitative glycan analysis of two specific glycans (1,688 m/z and 1,409 m/z) in grey matter across Braak stages. Data indicate a progressive increase in glycan abundance with disease advancement. e, Spatial glycomics images demonstrating the distribution and intensity of glycans (1,688 m/z and 1,409 m/z) in human brain samples across Braak stages. Spatial intensity increases correlate with disease severity, prominently highlighting regional glycan accumulation. Panel a created in BioRender. Sun, R. https://biorender.com/8cq7de3 (2026). Source data.
Hyperglycosylation in mouse AD brains
In an effort to investigate the metabolic mechanisms underlying hyperglycosylation, we sought to determine whether the 5xFAD and PS19 mouse models of AD replicate the hyperglycosylation phenotype observed in human AD brains. To address this, we performed spatial metabolomics, lipidomics and glycomics in 9-month-old wild-type (WT), 5xFAD and PS19 mouse brains (Fig. 3a), corresponding to a stage of significant disease manifestation.
Fig. 3: Conserved hyperglycosylation in the 5xFAD mouse model of AD. The alternative text for this image may have been generated using AI. Full size image a, A schematic representation of the multiomics workflow employed for spatial metabolomics, lipidomics and glycomics analysis on fresh frozen brain tissue sections from WT and 5xFAD mice, illustrating representative metabolite, lipid and glycan spatial distributions. b, Comparative heat maps of metabolite, lipid and glycan abundances in distinct brain regions (cortex, hippocampus, cerebellum, thalamus and hindbrain) from WT and 5xFAD mice. WT levels are set to 1 while the log 2 fold change (FC) values indicate significant alterations across regions, with pronounced increases in glycan abundance specifically observed in 5xFAD brains (n = 3 for each genotype). c, Spatial glycomics visualization of a representative high mannose glycan (m/z 1,257) distribution, demonstrating marked elevation in the 5xFAD model compared with WT. Corresponding violin plots quantify glycan abundance across multiple brain regions, confirming statistically significant increases in 5xFAD mice. Statistical analysis performed using two-tailed t-tests; exact P values are indicated. Source data.
Consistent with human AD samples, we identified widespread alterations in the metabolome and lipidome of 5xFAD and PS19 mice (Fig. 3b and Extended Data Figs. 2a and 3), corroborating previous studies that have linked AD pathology to disrupted energy metabolism and lipid homeostasis34. Notably, N-glycan profiling revealed the same hyperglycosylation phenotype both in the 5xFAD mouse model as well as the PS19 model, similar to those observed in human AD specimens (Fig. 3b,c and Extended Data Figs. 2c,d and 3a). Further, global spatial analysis demonstrated that hyperglycosylation was regionally specific, being most pronounced in the cortex, hippocampus and thalamus, while being less prominent in the cerebellum and hindbrain (Fig. 3c and Extended Data Figs. 2c,d and 3b). These findings suggest that hyperglycosylation preferentially affects regions associated with memory, cognitive processing and neuroinflammation, aligning with known patterns of neurodegeneration in AD. Taken together, these results indicate that hyperglycosylation is a conserved feature of AD pathology across species and suggest that specific brain regions may be differentially affected by this metabolic dysregulation.
Increased glycan biosynthesis in mouse models of AD
Having established that hyperglycosylation is a conserved phenotype in both human AD brains and major regions of the 5xFAD mouse model, it is critical to elucidate the underlying metabolic mechanisms driving hyperglycosylation. Hyperglycosylation can arise from either increased glycan biosynthesis within the endoplasmic reticulum (ER) and Golgi apparatus35 or reduced degradation and recycling through the lysosomal pathway15. To distinguish between these possibilities, we employed a stable isotope tracing approach coupled with a pulse-chase experiment36. The pulse phase provides a direct measure of de novo glycan biosynthesis, whereas the chase phase enables an assessment of glycan turnover and salvage activity (Fig. 4a). To facilitate deep metabolic tracing, we implemented a 13C-enriched liquid diet37, an approach that allows extensive isotopic labelling of glycans given their terminal position in metabolic pathways. Unlike small metabolic intermediates, which incorporate relatively few labelled carbons, N-glycans can integrate up to 40–60 labelled carbon atoms derived from glucose, posing challenges in resolving individual isotopologues. To address this, we leveraged the ion mobility capabilities of our MALDI system31,38, which discriminates molecular species based on their shape and size in addition to mass. This approach enables accurate identification of 13C-labelled glycans, as isotopologues exhibit predictable mass shifts while maintaining identical collision cross-section values, facilitating precise molecular characterization (Fig. 4b).
Fig. 4: Increased glycan biosynthesis drives hyperglycosylation in the 5xFAD mouse model. The alternative text for this image may have been generated using AI. Full size image a, A schematic of the stable isotope tracing experimental design used to differentiate glycan biosynthesis (pulse phase) from glycan degradation and recycling (chase phase) in WT and 5xFAD mice, employing a 13C-glucose enriched liquid diet. b, Ion mobility MSI (MALDI) showing 13C enrichment of the glycan species at 1,257 m/z, highlighting distinct isotopologue separation. c, The spatial distributions of unlabelled and 13C-labelled isotopologues of the glycan (m/z 1,257) across the mouse brain tissue section, demonstrating progressive labelling. d, Quantitative analysis comparing the enrichment levels of various isotopologues of glycan 1,257 m/z in WT (n = 3 animals) and 5xFAD (n = 3 animals) brains during the pulse phase, indicating significantly enhanced glycan biosynthesis in 5xFAD mice. Statistical significance determined by two-tailed t-tests. Data are mean ± s.e.m. e, Analysis of glycan isotopologue abundances following a 24-h washout period (chase phase), revealing no significant differences in glycan turnover between WT (n = 3 animals) and 5xFAD (n = 3 animals) mice. Data are mean ± s.e.m. f, A metabolic schematic illustrating the incorporation pathway of 13C-glucose into UDP-Hexose and UDP-HexNAc, key glycan biosynthetic precursors. g, LC–MS-based isotope tracing analysis confirming increased levels of labelled UDP-Hexose and UDP-HexNAc in 5xFAD (n = 3 animals) mice relative to WT controls (n = 3 animals), supporting elevated glycan biosynthesis. Data are mean ± s.e.m. P values are indicated. Statistical significance assessed by two-tailed t-tests. Panels created in BioRender: a, Sun, R. https://biorender.com/gj1e069 (2026); f, Sun, R. https://biorender.com/vjcm4pa (2026). Source data.
For the experimental groups, one cohort of mice was administered a 13C-labelled liquid diet for 24 h to measure biosynthetic flux (pulse phase), while a second cohort received the same diet followed by a 24-h washout period to evaluate glycan turnover (chase phase) (Fig. 4a). Spatially resolved MALDI imaging revealed distinct distributions of both native (M0) and labelled glycan species, confirming successful isotopic incorporation and metabolic tracing (Fig. 4b,c). A comparative analysis between WT and 5xFAD mice demonstrated a significant increase in glycan enrichment in 5xFAD mice, particularly in high mannose glycans such as the species with m/z 1,257 (Fig. 4d). This enrichment was evident across multiple isotopologues in 5xFAD mice relative to WT controls (Extended Data Fig. 4a–c), whereas no significant differences were observed following the 24-h washout period (Fig. 4e and Extended Data Fig. 4a–c). These data revealed that increased glycan biosynthesis, rather than impaired glycan degradation or salvage, is the predominant driver of hyperglycosylation in AD pathology.
To further substantiate these findings, we performed pooled liquid chromatography–mass spectrometry (LC–MS)-based isotope tracing from the same experimental cohorts. This analysis revealed a marked increase in labelled UDP-hexose and UDP-HexNAc (Fig. 4f,g), two key precursors in the N-glycan biosynthetic pathway39. To further confirm that glycan biosynthesis is increased in AD, we analysed the expression of glycan biosynthetic enzymes in both human and mouse AD models (Supplementary Figs. 5 and 6). Using RT–PCR and digital PCR, we quantified mRNA levels of key glycan biosynthesis genes in the ER and Golgi, including Mgat, Man1a2 and B4galt1. In both human AD brains and 5xFAD mouse models, we observed upregulation of these genes compared with their respective controls (Supplementary Figs. 5 and 6). These findings further support the notion that increased glycan biosynthesis is a key factor driving hyperglycosylation in AD.
UDP-GlcNAc functions as the shared substrate for multiple biosynthetic pathways, including N-glycosylation, O-GlcNAcylation and hyaluronic acid production (Extended Data Fig. 5a). To determine whether the observed increase in UDP-GlcNAc and N-linked glycosylation extends to these alternative downstream pathways, we quantified O-GlcNAcylation and hyaluronic acid levels in both WT and AD mouse models. For hyaluronic acid, we adopted previously established MALDI imaging methods based on hyaluronidase digestion to generate oligosaccharides that can be spatially resolved and quantified40 (Extended Data Fig. 5b). For O-GlcNAcylation, we performed immunofluorescence staining using a well-validated O-GlcNAc–specific antibody, followed by quantification of fluorescence intensity. Both analyses revealed consistent results showing that 5xFAD and PS19 mouse brains exhibited markedly decreased hyaluronic acid abundance (Extended Data Fig. 5c) and reduced O-GlcNAcylation (Extended Data Fig. 5d) compared with WT controls. These findings demonstrate that despite elevated UDP-GlcNAc availability, its utilization is not globally upregulated across all downstream pathways.
Glycoproteomic analysis
The observed hyperglycosylation phenotype raised the question of whether this increase is due to the emergence of novel glycosylated proteins or an upregulation of glycosylation modifications on pre-existing proteins. To address this, we conducted glycoproteomic analysis in both human and mouse samples. Similar to our glycan enzyme transcriptomics approach, we analysed pooled samples of human normal and AD frontal cortical tissues as well as WT and 5xFAD mouse brains. Given the necessity of enriching membrane glycoproteins before mass spectrometry analysis, we pooled n = 4 samples per group to ensure sufficient input material. Membrane proteins were first extracted and enriched using high-salt and carbonate-based fractionation, followed by sequential ultracentrifugation. Isolated membrane fractions were denatured, reduced, alkylated and subjected to protease digestion. Glycopeptides were subsequently analysed using nano-LC coupled to a high-resolution Thermo Eclipse mass spectrometer (Supplementary Figs. 7 and 8). Glycoproteomic datasets were processed using Proteome Discoverer (v3.0), with glycoproteins identified through Byonic database searches (Supplementary Data 1).
From mouse samples, we identified 137 unique glycopeptides (Supplementary Fig. 7), while human extracts yielded 77 unique glycopeptides (Supplementary Fig. 8). Relative quantification revealed a significant increase in glycopeptide abundance in AD samples compared with their respective WT controls (Supplementary Figs. 7b and 8b), further supporting the hyperglycosylation phenotype identified via MALDI. Notably, 55% and 75% of glycopeptides were shared between human and mouse samples (Supplementary Figs. 7c and 8c), respectively. Since multiple glycopeptides can be derived from the same protein, we observed over 90–95% overlap in glycoprotein identities between normal and AD samples (Supplementary Data 1). These findings indicate that hyperglycosylation in AD predominantly involves an increase in glycosylation modifications on pre-existing glycoproteins rather than the appearance of novel glycosylated proteins. Finally, we conducted cell-type enrichment analysis through WebCSEA41, based on the identified glycopeptides to infer which neuronal populations are most affected by hyperglycosylation. Our analysis suggests that neurons are the predominant cell population undergoing enhanced glycosylation, underscoring the potential role of aberrant glycosylation in neuronal dysfunction and AD pathogenesis (Supplementary Figs. 7d,e and 8d,e).
Genetic and dietary interventions of glycosylation during neurodegeneration
To determine whether hyperglycosylation is a causal driver of neurodegeneration or a secondary consequence of disease pathology, we tested both genetic and dietary strategies to selectively decrease and increase N-glycan levels in the brain. This approach allowed us to assess the functional impact of altered glycosylation on neurobehavioural outcomes and neuropathological markers in AD (Fig. 5a). To suppress glycosylation, we first targeted phosphoglucomutase 3 (PGM3), a key enzyme in the hexosamine biosynthetic pathway responsible for converting glucosamine-6-phosphate to N-acetylglucosamine-6-phosphate. Eight-month-old female 5xFAD and PS19 mice received either shScrambled or shPGM3 packaged in lentivirus delivered via stereotaxic injection into the ventricles for whole-brain distribution. Following a 2-week intervention period, we assessed glycan levels using spatial glycomics and performed neurobehavioural testing to evaluate cognitive outcomes (Fig. 5b). Spatial glycomics confirmed decreases in global (Supplementary Figs. 9 and 10) as well as representative N-glycans across multiple regions in both 5xFAD (Fig. 5d–e) as well as PS19 mice (Extended Data Fig. 6b,c). To assess the functional impact of these treatments, we performed a social memory test, a behavioural paradigm that measures recognition memory by tracking social interaction time across repeated exposures42. In this test, mice are expected to progressively reduce their interaction time with a familiar conspecific over four trials, reflecting intact social recognition memory (Fig. 5h). Notably, shPGM3-treated 5xFAD as well as PS19 mice exhibited significant improvement in social memory interaction patterns when compared with the shScr-treated mice (Fig. 5i and Extended Data Fig. 6e). To evaluate potential off-target consequences of reducing N-glycosylation in the absence of disease, we performed the same intracerebroventricular lentiviral shPGM3 intervention in age-matched WT mice (Extended Data Fig. 7a). Animals underwent social memory testing and spatial glycomics analysis at the experimental end point. Although we observed a modest reduction in global N-glycan levels (Supplementary Fig. 11), individual glycan changes did not reach statistical significance (Extended Data Fig. 7b). Importantly, social memory performance in WT mice with shPGM3 remained unchanged compared with shScr controls (Extended Data Fig. 7d). These findings indicate that targeted reduction of glycosylation does not impair cognitive behaviour under baseline physiological conditions.
Fig. 5: Targeting hexosamine pathway-dependent N-glycosylation reduces brain N-glycans and improves social memory in 5xFAD mice. The alternative text for this image may have been generated using AI. Full size image a, A schematic of the hexosamine pathway and ER N-glycosylation, highlighting inhibition of PGM3 and OST (by NGI-1). b, The experimental design for 8-month-old 5xFAD mice injected with shScr or shPGM3 and tested for social memory 2 weeks later. c, The experimental design for 5xFAD mice treated with vehicle or NGI-1 and tested for social memory 2 weeks later. d,e, MALDI imaging and violin plots of representative two unique complex N-glycans (N-glycan structure shown on the left) showing reduced brain N-glycan abundance in 5xFAD-shPGM3 mice compared with 5xFAD-shScr controls. f,g, MALDI imaging and violin plots of representative two unique complex N-glycans (N-glycan structure shown on the left) showing decreased levels in NGI-1–treated 5xFAD brains compared with vehicle (veh)-treated 5xFAD mice. h, A schematic of the social memory test across four interaction trials. i, Social memory performance across trials showing improved memory retention in 5xFAD-shPGM3 mice (n = 5 animals) compared with 5xFAD-shScr mice (n = 4 animals). j, Social memory performance in NGI-1-treated (n = 5 animals) and vehicle-treated 5xFAD (n = 5 animals) mice showing partial behavioural rescue with NGI-1. Data are mean ± s.e.m. P values are indicated (two-tailed t-test for glycan comparisons; two-way repeated-measures ANOVA for behaviour). Panels created in BioRender: a, Sun, R. https://biorender.com/wa4lg3j (2026); b, Sun, R. https://biorender.com/n41h483 (2026); c, Sun, R. https://biorender.com/dzklqk3 (2026); h, Sun, R. https://biorender.com/n8icm0r (2026). Source data.
To further validate the effect of reducing N-glycosylation on memory function, we targeted the oligosaccharyltransferase complex using NGI-1, a small-molecule OST inhibitor that blocks N-glycan transfer to nascent proteins (Fig. 5a). A single intracerebroventricular administration of NGI-1 (2 nmol in 2 µl) was delivered into the lateral ventricle of 8-month-old 5xFAD mice. After a 2-week interval, animals underwent social memory testing followed by in situ spatial glycomics (Fig. 5c). NGI-1 treatment decreased brain N-glycan abundance (Fig. 5f,g and Supplementary Fig. 12) and improved social recognition performance compared with vehicle controls (Fig. 5j). These data reinforce that lowering excessive N-glycosylation is sufficient to enhance cognitive outcomes and highlight hyperglycosylation as an actionable target for dementia-related memory decline in mice.
Glucosamine is known to readily cross the blood–brain barrier and incorporate directly into brain glycans43, making it an ideal substrate for investigating the effects of increased glycosylation (Fig. 6a). If hyperglycosylation is an active contributor to AD pathology, we hypothesized that glucosamine supplementation would exacerbate neurodegenerative phenotypes, whereas PGM3 inhibition would have protective effects. A separate cohort of 5xFAD mice received daily oral gavage of glucosamine at 457 mg kg−1 day−1, with the dose calculated based on human therapeutic equivalent dose of ~2,500 mg day−1 or 36 mg kg−1 day−1 followed by a standard human to mouse dose calculation44 (Fig. 6b). Conversely, glucosamine supplementation significantly increased glycosylation across the brain, as shown by global heat map analysis (Supplementary Fig. 13) and representative spatial mapping of key glycans (Fig. 6c,d). By contrast, glucosamine-treated 5xFAD mice exhibited a further exacerbation of social memory deficits, showing no recognition of previously encountered conspecifics across trials (Fig. 6e).
Fig. 6: Glucosamine increases brain N-glycans, worsens social memory in 5xFAD mice and is associated with adverse outcomes in real-world evidence of dementia cohorts. The alternative text for this image may have been generated using AI. Full size image a, A schematic of glucosamine entry into the hexosamine pathway, increasing N-acetyl-glucosamine and ER protein N-glycosylation. b, Experimental design: 8-month-old 5xFAD mice receive glucosamine or vehicle for 2 weeks followed by social memory testing. c,d, MALDI imaging and violin plots of representative two unique complex N-glycans (N-glycan structure shown on the left) showing higher brain N-glycan abundance in glucosamine-treated 5xFAD mice compared with water-treated controls. P values are indicated (two-tailed t-test). e, Social memory performance across four trials demonstrating impaired memory in glucosamine-treated 5xFAD mice (n = 6 animals) relative to vehicle-treated 5xFAD mice (n = 7 animals). Data are mean ± s.e.m. P values are indicated (two-way repeated-measures ANOVA for behaviour). f, A schematic of EHR cohort construction from non-dementia controls, MCI and dementia diagnoses (AD and ADRD) with identification of glucosamine exposure from medication records. g, The proportion of patients with documented glucosamine use in the MCI and ADRD cohorts. h, Ten-year all-cause survival curves for patients with ADRD with or without glucosamine use, showing reduced survival in glucosamine users. Data are mean ± 95% confidence intervals. i, Ten-year all-cause survival in patients with MCI, showing no significant difference between glucosamine users and non-users (log-rank P = 0.252). Data are mean ± 95% confidence intervals. j, The cumulative incidence of transition from MCI to AD over time, revealing a higher conversion rate among glucosamine users compared with matched non-users. Data are mean ± 95% confidence intervals. Panels created in BioRender: a, Sun, R. https://biorender.com/9uxxwcu (2026); b, Sun, R. https://biorender.com/ouipb70 (2026);f, Sun, R. https://biorender.com/1bixssx (2026). Source data.
To further investigate neuropathological changes, we performed immunofluorescence analysis of reactive astrocytes and Aβ staining to quantify β-amyloid plaques (Extended Data Figs. 8 and 9). Interestingly, neither shPGM3, NGI-1 nor glucosamine treatment impacted the number of reactive astrocytes or the abundance of β-amyloid plaques (5xFAD) or tauopathy (PS19) during the duration of the experiment, while resulting in behavioural benefit (Extended Data Figs. 8 and 9 and Supplementary Fig. 14). While STT3A protein levels did not increase in 5xFAD or PS19 mice when compared with normal controls (Supplementary Fig. 15), we did observe a mild increase in STT3A and ALG13 protein levels when examined by immunofluorescence following glucosamine supplementation (Supplementary Fig. 16), suggesting substrate-level regulation of these enzymes. These findings demonstrate that glycosylation is an actionable target for AD-related neurocognitive deficits. The improvement in social memory following glycan biosynthesis inhibition suggests that hyperglycosylation contributes functionally to AD-related behavioural impairments. Conversely, the worsening of social memory with glucosamine supplementation supports the notion that elevated glycan biosynthesis exacerbates disease pathology. Collectively, these results establish a causal role for hyperglycosylation in AD-associated cognitive dysfunction and highlight the therapeutic potential of targeting glycan metabolism to mitigate neurodegenerative progression.
Real-world impact of glucosamine in the dementia patient population
Given that glucosamine exacerbates cognitive deficits in the 5xFAD mouse model, we sought to determine whether this effect extends to human populations. As glucosamine is a widely available over-the-counter supplement commonly used for joint health, it is plausible that some dementia patients may be using it regularly. To investigate whether glucosamine usage influences clinical outcomes in AD, we analysed clinical records from the University of Florida Health (UF Health) system, identifying over 50,000 patients diagnosed with Alzheimer’s disease-related dementias (ADRDs). Using physician notes and prescription records, we identified patients who had documented glucosamine usage for at least 1 year following a dementia diagnosis. MCI, clinically defined as a prodromal phase rather than a definitive dementia diagnosis, served as a practical pre-dementia comparison group. Further, since cognitively healthy individuals tend to have fewer healthcare visits, the MCI group provides a more appropriate comparator group for those with confirmed dementia (Fig. 6f). After applying inclusion criteria, we identified 24,481 patients with ADRD and 41,884 patients with MCI for the survival analysis. From this group, the median follow-up duration was 1,835 days (~5 years). In total, 6,764 patients with ADRD and 4,651 patients with MCI had a recorded death date, while 1,896 patients with ADRD and 2,750 patients with MCI received glucosamine.
To ensure the accuracy and consistency of our glucosamine exposure classification, we first assessed the percentage of patients within each diagnostic category (AD, ADRD and MCI) who had documented glucosamine usage. Across all three groups, approximately 8% of patients were identified as glucosamine users, confirming that physician notes provide a reproducible and reliable method for classifying supplement use (Fig. 6g). Next, we performed a 10-year survival analysis in all three cohorts, adjusting for age, sex and demographics (Supplementary Fig. 17). Our analysis revealed that glucosamine usage was associated with a 25% increase in mortality risk among ADRD patients (P = 0.0023; Fig. 6h). By contrast, glucosamine usage did not significantly impact mortality risk in the MCI cohort (Fig. 6i), suggesting that the effects of glucosamine may be specific to individuals with established neurodegeneration rather than the general ageing population.
To further assess whether glucosamine supplementation is associated with worsening dementia symptoms, we analysed the transition from MCI to ADRD. While most individuals with MCI remain stable or even recover, approximately 5% progress to ADRD, representing a clinical worsening of cognitive decline. Using similar survival and transition analyses, we quantified the rate of MCI-to-ADRD conversion among patients with or without documented glucosamine use. In this analysis, we observed a 25% increase in the proportion of patients with MCI transitioning to ADRD in the glucosamine user group (Fig. 6j), indicating that glucosamine supplementation is associated with accelerated disease progression or worsened disease phenotype.
Glucosamine supplementation in WT mice
Given that glucosamine supplementation did not impact survival in the MCI patient cohort, we sought to determine whether the absence of an effect in this population reflects an inherent resilience of the non-diseased brain to glucosamine-induced hyperglycosylation. To address this, we subjected 8-month-old WT mice to the same glucosamine treatment regimen as used in 5xFAD mice. Mice received daily oral gavage of glucosamine for 2 weeks, with the dose adjusted based on human-equivalent scaling to match prior preclinical interventions (Extended Data Fig. 7e). Following the treatment period, we performed spatial glycomics analysis to assess glycan abundance across brain regions, followed by behavioural testing to determine whether glucosamine altered cognitive function in non-diseased mice.
Strikingly, glucosamine supplementation did not result in hyperglycosylation in WT mouse brains (Extended Data Fig. 7f), in contrast to the robust increase observed in 5xFAD mice. Detailed glycomics analysis revealed no significant changes in N-glycan abundance across multiple glycan species (Extended Data Fig. 7f), suggesting that normal glycan homeostasis is maintained in the absence of AD pathology. Furthermore, we assessed social memory performance using a four-trial system in which mice were exposed to the same social stimulus multiple times. In cognitively intact mice, social interaction time is expected to decrease over successive trials, reflecting recognition of the familiar conspecific (Extended Data Fig. 7c). Both vehicle- and glucosamine-treated WT mice exhibited this expected pattern of behaviour, with progressive reductions in interaction time across trials. Importantly, there was no statistically significant difference between the two groups, indicating that glucosamine supplementation did not impair social recognition memory in WT mice (Extended Data Fig. 7g). This contrasts with the deficits observed in 5xFAD mice, supporting the notion that the normal brain possesses intrinsic resilience mechanisms that buffer against the metabolic perturbations induced by glucosamine supplementation.


© All Rights Reserved.