On 410 official-current C2DB groups, Identity achieved 0.2835 eV and Huber Anchor 0.2885 eV, whereas Residual Bridge reached 0.3193 eV.
5 Full size image Frozen conformal triage consistently concentrates the lowest-error external inorganic predictions.
Residual Bridge improved the JARVIS-MBJ to C2DB route, whereas the dominant 2DMatPedia-PBE to C2DB route benefited from simpler correction.
For supporting VBM, Standard Gate reached 0.0381 eV, with RiskArgminRouter at 0.0385 eV and Residual Bridge at 0.0391 eV.
Risk routing delivered its strongest decision-level improvement in iodide groups, while preserving the Residual Bridge decisions in Br and Cl groups.
Structure matching and development benchmark
The structure audit accepted 1,416 STRICT and 556 STANDARD cross-source pairs; 625 cross-source and 739 within-source pairs passed only the lenient profile and were excluded. The accepted graph formed 1,056 cross-source material groups. The support-gated Residual Bridge achieved 0.2465 eV development material-group macro MAE, compared with 0.2492 eV for Huber Anchor and 0.2549 eV for Constant Delta, corresponding to a paired gain over Huber Anchor of -0.0027 eV (95% CI, -0.0051 to -0.0003 eV).
Risk routing achieves the best deployable development performance
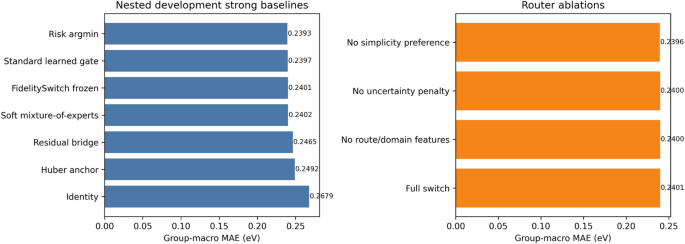
RiskArgminRouter achieved the lowest non-oracle Stage-7 A development material-group macro MAE at 0.2393 eV, followed by Standard Gate at 0.2397 eV, frozen FidelitySwitch-2D at 0.2401 eV and Soft MoE at 0.2402 eV. The Oracle Router reached 0.2215 eV, revealing additional candidate-selection headroom. All deployable Stage-7 A methods in Table 1 used the same five outer material-group-disjoint evaluation folds. Hyperparameters designated for data-adaptive tuning were selected using only the corresponding outer-training partition through inner-fold evaluation; fixed computational settings specified in the locked stage configurations were not selected using the held outer fold or any external target. Ablations of the uncertainty penalty, simplicity preference and route/domain features confirmed the stability of deployable routing performance. Figure 1; Table 1 summarize these comparisons.
Fig. 1 Full size image Nested development baselines and router ablations. Risk-argmin routing achieves the lowest non-oracle material-group macro MAE, with the oracle result revealing further selection headroom.
Table 1 Nested development point-prediction performance. Full size table
Sealed external audits demonstrate negative-transfer protection
The external audits provided a stringent test of whether frozen routing could protect against a nonlinear correction that failed after database shift. On 410 official-current C2DB groups, Identity achieved 0.2835 eV and Huber Anchor 0.2885 eV, whereas Residual Bridge reached 0.3193 eV. Residual Bridge was worse than Huber Anchor by + 0.0308 eV (95% CI, + 0.0164 to + 0.0448 eV) and worse than Identity by + 0.0357 eV (95% CI, + 0.0146 to + 0.0557 eV). On 490 independent MC2D groups, FidelitySwitch-2D achieved 0.3260 eV, compared with 0.3202 eV for Identity and 0.3272 eV for Huber Anchor, and reduced Residual Bridge error (0.3817 eV) by 0.0557 eV (95% CI, 0.0420 to 0.0693 eV). We therefore report the exact differences rather than treating the word ‘comparable’ as a formal equivalence claim. Figures 2 and 3 summarize the external point-performance results.
Fig. 2 Full size image External inorganic point performance. The frozen switch substantially limits residual-model negative transfer on the independent MC2D audit while retaining competitive overall accuracy.
Fig. 3 Full size image Paired material-group MAE differences in prediction-sealed inorganic audits. Values below zero favor the first-named method.
Frozen risk scores concentrate highly accurate external predictions
Frozen 90% group-simultaneous coverage reached 0.9756 on C2DB and 0.9531 on MC2D, with uncertainty-error Spearman correlations of 0.6668 and 0.5352. Here, group-simultaneous coverage is a group-level event: a material group is counted as covered only when every row belonging to that group lies within its corresponding interval. ACCEPT groups achieved MAEs of 0.1915 eV on C2DB and 0.0744 eV on MC2D, substantially below the overall errors near 0.3 eV. A matched-coverage diagnostic on the opened MC2D target further showed that frozen risk selection outperformed random and route-only selection. These results indicate that the frozen risk score can enrich low-error external predictions, while the coverage interpretation remains conditional on the approximate group-exchangeability assumptions discussed below. Figures 4 and 5 report coverage and triage performance.
Fig. 4 Full size image External transfer of frozen 90% material-group conformal coverage in the inorganic audits.
Fig. 5 Full size image Frozen conformal triage consistently concentrates the lowest-error external inorganic predictions.
Route-aware correction captures heterogeneous source-target behavior
External behavior differed strongly by source-target route, confirming that route support is an important determinant of when adaptive correction helps. Residual Bridge improved the JARVIS-MBJ to C2DB route, whereas the dominant 2DMatPedia-PBE to C2DB route benefited from simpler correction. On MC2D, FidelitySwitch-2D reduced Residual Bridge error overall, while the best fixed candidate varied across routes; a route Constant Delta diagnostic reached 0.3156 eV. Route-resolved results are reported where group counts permit interpretation. We did not add a nominal leave-one-route-out retraining experiment because the currently archived reproducibility package does not contain the restricted/raw inputs needed to refit every base candidate with one entire route absent; treating already-generated candidate predictions as if the route had been absent during candidate fitting would not constitute the experiment requested. We therefore retain the two fully withheld external database audits as the stronger route-shift evidence and identify full route-withheld retraining as future validation. Figure 6 summarizes the observed route heterogeneity.
Fig. 6 Full size image Route-specific translation behavior relative to the relevant simple fixed comparator. Prediction-sealed comparisons provide the primary evidence, while opened-target additions contextualize route heterogeneity.
Target-sealed routing delivers strong multi-property HOIP performance
The HOIP lockbox contained 57 independent publication/structure groups and 94 rows for each confirmatory or supporting r2SCAN task. For band gap, RiskArgminRouter achieved the lowest observed MAE at 0.0498 eV, compared with 0.4312 eV for Identity, 0.0672 eV for Huber Anchor and 0.0527 eV for Residual Bridge. Its − 0.0029 eV difference from Residual Bridge had a 95% group-block bootstrap interval of -0.0064 to + 0.0005 eV; because this interval includes zero, the comparison is treated as not decisive despite the complementary Holm-adjusted Wilcoxon result. For confirmatory CBM, RiskArgminRouter again had the lowest observed MAE at 0.0351 eV versus 0.0577 for Identity, 0.0469 for Huber Anchor and 0.0362 for Residual Bridge. For supporting VBM, Standard Gate reached 0.0381 eV, with RiskArgminRouter at 0.0385 eV and Residual Bridge at 0.0391 eV. These results demonstrate useful transfer within this chemically distinct HOIP cohort, but the 57-group lockbox is not sufficient to establish universal multi-property generalization. Table 2; Fig. 7 summarize the results.
Table 2 Target-sealed HOIP multi-property performance (material-group macro MAE, eV). Full size table
Fig. 7 Full size image Target-sealed HOIP multi-property performance and frozen triage. Risk routing achieves the lowest MAE for band gap and CBM, while frozen triage consistently concentrates highly accurate groups.
Selective risk ranking transfers consistently across HOIP properties
Frozen ACCEPT subsets contained 33 of 57 band-gap groups, 40 of 57 CBM groups and 39 of 57 VBM groups, with MAEs of 0.0187, 0.0194 and 0.0168 eV, respectively. Matched-coverage curves showed substantially lower risk than random selection for all three tasks; band-gap, CBM and VBM AURCs from 20% to 100% accepted coverage were 0.0190, 0.0174 and 0.0184 eV. Observed 90% group-simultaneous coverage was 51/57 (0.8947) for band gap and VBM and 47/57 (0.8246) for CBM. Exact 95% intervals were 0.7848–0.9604 and 0.7009–0.9125, respectively. The CBM result indicates calibration strain rather than nominal 90% performance and motivates larger property-specific calibration cohorts. Figure 8; Table 3 summarize coverage and frozen selective performance.
A post-open matched-coverage diagnostic on the previously target-sealed HOIP lockbox compared the frozen predicted-risk score with candidate disagreement, conformal half-width, random selection and an oracle-error selector. These additional selectors were used to interpret the source of selective utility and did not alter any model, threshold, calibrator or confirmatory claim.
Fig. 8 Full size image HOIP group-simultaneous coverage with exact 95% binomial intervals. Band gap and VBM track the nominal target closely, while CBM provides a clear target for further calibration refinement.
Table 3 Frozen selective performance across independent lockboxes. Full size table
Simulation-to-experiment translation establishes an external validation benchmark
The prespecified PBE-to-experimental band-gap task contained only 25 groups and was treated as exploratory. Standard Gate achieved the lowest observed MAE at 0.1996 eV; Residual Bridge reached 0.2193 eV, RiskArgminRouter 0.2377 eV and Huber Anchor 0.2850 eV. The result shows that the framework can be evaluated against experimental gaps, but the sample is too small to support a broad claim of simulation-to-experiment translation. It is therefore presented as an initial benchmark and a basis for larger independently sealed experimental studies.
Frozen predictions improve downstream screening decisions
The screening audit converted frozen PBE-to-r2SCAN band-gap predictions into publication/structure-group decisions over a 19-threshold grid fixed before Stage 7E execution. Mean threshold misclassification was 0.0896 for Identity, 0.0092 for Residual Bridge and 0.0074 for RiskArgminRouter. The router corrected two residual-model threshold decisions, at 2.50 and 3.00 eV, and introduced no threshold-level harms on the fixed grid. Across three fixed screening windows, the router matched Residual Bridge in the 0.5–1.5 and 1.0–2.0 eV windows and reduced errors from three to two in the 1.5-3.0 eV window. The frozen ACCEPT subset further reduced mean threshold error to 0.0048 and concentrated the lowest router MAE. Chemistry stratification localized the strongest benefit to iodide groups (n = 17), where routing reduced MAE from 0.0272 to 0.0176 eV and mean threshold error from 0.0093 to 0.0031. Figures 9, 10, 11 and 12; Tables 4, 5, 6, 7 and 8 report the detailed results. The audit translates the reliability framework into concrete material-level screening gains without refitting or retuning the frozen models.
Fig. 9 Full size image Materials-screening consequence audit. Fixed-threshold material-group misclassification compares frozen simple, nonlinear and risk-routed translations; the ACCEPT subset shows the strongest screening reliability.
Fig. 10 Full size image Chemistry-stratified threshold error in the HOIP lockbox. Risk routing delivered its strongest decision-level improvement in iodide groups, while preserving the Residual Bridge decisions in Br and Cl groups.
Material-level analyses confirm screening and subgroup gains
Across the prespecified threshold grid, the strongest frozen methods produced very low decision error. RiskArgminRouter improved on Residual Bridge for the full cohort, while Soft MoE and Huber Anchor achieved the lowest error within the ACCEPT subset. Fixed-window analysis produced identical decisions in two windows and one fewer false inclusion for the router in the broad 1.5-3.0 eV window (Tables 4 and 5). These complementary results show that the framework supports both global screening accuracy and method-specific gains within high-confidence subsets.
Table 4 Integrated fixed-threshold screening performance. Bold denotes the lowest error within each subset. Full size table
Table 5 Fixed-window screening performance. Bold denotes the lowest error rate within each window; ties are retained. Full size table
Frozen triage established a monotonic materials-risk gradient: ACCEPT groups had the lowest threshold error and router MAE, REVIEW groups were intermediate, and ABSTAIN groups were highest risk. The matched-random analysis reinforced this enrichment pattern and showed that the frozen triage rule concentrated materially more reliable predictions than indiscriminate selection (Table 6).
Table 6 Frozen triage enrichment and matched-random comparison. Bold denotes the most favorable observed triage value. Full size table
The subgroup audit identifies where correction choice creates the largest materials benefit. Iodide groups show the strongest router improvement, while bromide and chloride threshold decisions remain stable. Monolayer and multilayer summaries preserve the favorable direction of the observed effects (Table 7).
Table 7 Chemistry and layer subgroup audit. Bold denotes the lower error within each paired subgroup comparison. Full size table
The case audit identified two publication/structure groups for which routing corrected at least one Residual Bridge screening decision. Both cases show lower absolute error under routing, and no harmed material group occurred on the fixed threshold and window decisions (Table 8; Fig. 12).
Table 8 Material groups rescued by RiskArgminRouter relative to Residual Bridge. Bold denotes the lower absolute error. Full size table
Fig. 11 Full size image Fixed-window materials-screening performance. RiskArgminRouter matches Residual Bridge in two windows and reduces the error count from three to two in the broad 1.5-3.0 eV window.