Dialysis sessions lasted approximately 3–4 h and were prescribed according to each patient’s clinical condition and dialysis requirements.
Laboratory parameters measured were (Hb, g/dL), (TSAT, %), serum Fe, total Fe-binding capacity (TIBC), serum ferritin, serum creatinine, blood urea nitrogen (BUN), serum oxalate, and estimated glomerular filtration rate (eGFR).
Parameters recorded included EPO dose (U/kg/week), Hb (g/dL), TSAT (%), serum Fe, TIBC, serum ferritin, serum creatinine, BUN, eGFR, and serum oxalate.
Measurement of serum oxalate served as a safety evaluation to monitor potential hyperoxalemia and calcium oxalate stone formation associated with high-dose Vit C administration.
Serum oxalate assay procedureSerum oxalate concentration was measured through a Human Oxalic Acid Enzyme-Linked Immunosorbent Assay (ELISA) Kit (reference range: 47–98 mol/mL).
Study design and participants
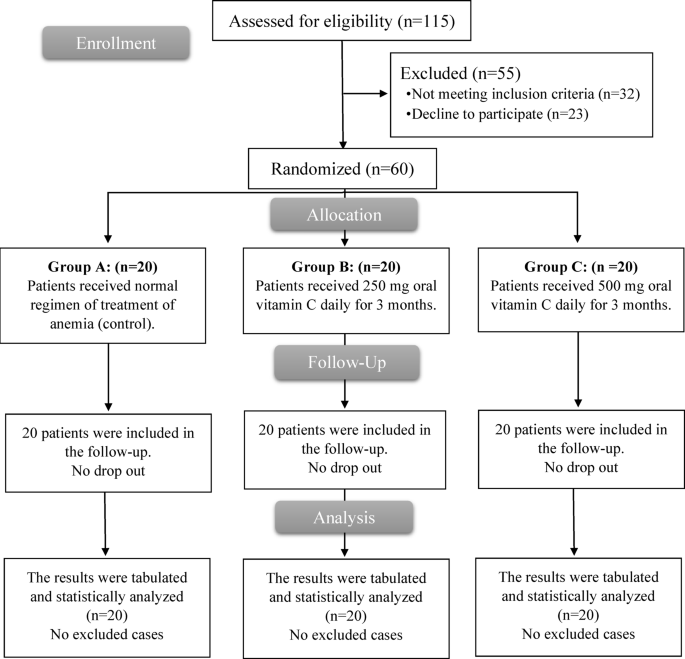
This randomized, open label prospective trial enrolled 60 patients, comprising both sexes, aged > 18 years, on stable HD for ≥ 90 days with Hb 9–11 g/dL (as elevated Hb warrants EPO dose reduction), receiving ≥ 4000 U EPO per HD session with an unchanged dose for 2 months, ferritin > 100 µg/L, transferrin saturation (TSAT) < 30%, not on Vit C or Fe supplements in the preceding 2 months, and whose prior 2-month stable EPO dose served as the control.
Excluded patients were those with gastrointestinal bleeding, who had received blood transfusion, had malignancy, or a history of hospital admission or noncompliance with dialysis and/or medications, with participants also censored if such events occurred during the work period.
Study setting and ethical approval
The study was conducted at the HD unit of Ain Shams university Hospital, Cairo, Egypt. This clinical trial adhered to Good Clinical Practice standards, the ethical principles outlined in the Declaration of Helsinki, and the CONSORT reporting guidelines. The protocol was approved by the ethical committee of Ain-Shams University Hospitals (approval code: 252) and registered on ClinicalTrials. gov on July 13, 2025, and first appeared publicly on the site on July 21, 2025 (ID: NCT07076108). All patients signed a written informed consent.
Enrollment and allocation
To maintain the integrity of the work, a random allocation process was used, employing a computer-generated sequence (https://www.randomizer.org/). Eligible participants were randomly assigned into three equal groups (1:1:1 ratio): Group A (20 patients) received the standard anemia treatment regimen as control (EPO was administered at 4,000 international units per session, with a total weekly dose of 50–100 units/kg. If the patient remained anemic, the EPO dose was increased), Group B (20 patients) received 250 mg oral Vit C daily for 3 months, and Group C (20 patients) received 500 mg oral Vit C daily for 3 months.
Hemodialysis procedure
All patients were receiving regular maintenance HD at the Hemodialysis Unit of Ain Shams University Hospitals. HD was performed using high-flux dialyzers, with blood flow rates ranging from 250 to 400 mL/min and a dialysate flow rate of 500 mL/min. Dialyzer membrane surface areas of 1.8–2.2 m² were used according to individual clinical requirements. Dialysis sessions lasted approximately 3–4 h and were prescribed according to each patient’s clinical condition and dialysis requirements. Dialysis adequacy was routinely assessed using Kt/V.
Nutritional management
All patients were receiving routine nutritional care at the Hemodialysis Unit of Ain Shams University Hospitals according to the Kidney Disease Outcomes Quality Initiative (KDOQI) clinical practice recommendations for nutrition in chronic kidney disease. The nutritional care plan aimed to provide adequate protein and energy intake, with approximately 1.0–1.2 g/kg/day of protein and 25–35 kcal/kg/day of energy, with individualized adjustments according to each patient’s nutritional and clinical status. Sodium intake was restricted, whereas dietary potassium and phosphorus intake was individualized according to biochemical parameters. Fluid intake was adjusted according to residual urine output and interdialytic weight gain. Nutritional counseling and regular clinical monitoring were provided as part of routine hemodialysis care.
Baseline assessment
At baseline, all participants underwent a comprehensive evaluation to establish demographic, clinical, and laboratory profiles. Demographic and clinical data included age (years), sex (male/female), body weight (kg), dialysis vintage (years on HD), Kt/V (to quantify HD adequacy), and EPO dose (units per kilogram per week). Laboratory parameters measured were (Hb, g/dL), (TSAT, %), serum Fe, total Fe-binding capacity (TIBC), serum ferritin, serum creatinine, blood urea nitrogen (BUN), serum oxalate, and estimated glomerular filtration rate (eGFR).
Follow-up
Participants were monitored monthly for three months. At each follow-up visit, Hb, serum Fe, and TSAT titres were reassessed, and any changes in Epo dosing were documented—this enabled evaluation of treatment response and anemia management adjustments over time.
At the end of the three-month intervention period, a repeat comprehensive assessment was performed. Parameters recorded included EPO dose (U/kg/week), Hb (g/dL), TSAT (%), serum Fe, TIBC, serum ferritin, serum creatinine, BUN, eGFR, and serum oxalate. Measurement of serum oxalate served as a safety evaluation to monitor potential hyperoxalemia and calcium oxalate stone formation associated with high-dose Vit C administration.
Serum oxalate assay procedure
Serum oxalate concentration was measured through a Human Oxalic Acid Enzyme-Linked Immunosorbent Assay (ELISA) Kit (reference range: 47–98 mol/mL). All reagents, standard solutions, and samples were prepared according to manufacturer instructions and brought to room temperature before use. Assays were performed at room temperature. The required number of assay strips was placed into frames, and unused strips were stored at 2–8 °C. Fifty microliters of standard solution were added to the standard wells, without the addition of biotinylated antibody, as the standard already contained it. For sample wells, 40 µL of serum sample was added, followed by 10 µL of anti-oxalate (OA) antibody, and then 50 µL of streptavidin-HRP was added to both sample and standard wells (excluding blank control wells). The wells were thoroughly mixed, sealed, and incubated at 37 °C for 60 min.
After incubation, the plate sealer was removed, and wells were washed five times with 300 µL of wash buffer per wash, each lasting 30 s to 1 min. Automated washing was performed by aspirating or decanting wells before each wash. The plate was blotted dry on absorbent material. Subsequently, 50 µL of substrate solution A and 50 µL of substrate solution B were added to each well, and the plate was incubated for 10 min at 37 °C in the dark with a fresh sealer. The reaction was stopped by adding 50 µL of stop solution to each well, producing an immediate color change from blue to yellow.
Optical density (OD) was measured at 450 nm within 10 min of adding the stop solution through a Thermoscientific Multiskan FC microplate reader. Serum oxalate concentrations were calculated from the standard curve, and values were interpreted with reference to the established normal range of 47–98 mol/mL.
Study outcomes
The primary outcomes: the co-primary endpoints were the effect of daily oral Vit C supplementation at two different doses (250 mg and 500 mg) on Fe utilization, assessed by changes in TSAT (%) and serum ferritin (SF, µg/L), and on EPO dose requirements (U/kg/week) from baseline to 3 months, while ensuring patient safety (monitoring serum oxalate levels to evaluate risk of hyperoxalemia).
The secondary outcomes: included mean change from baseline to 3 months in Hb (g/dL), serum Fe (SI, µg/dL), (TIBC, µg/dL), biochemical markers including serum creatinine (SCr, mg/dL), BUN (mg/dL), estimated GFR (mL/min/1.73 m²), and serum oxalate (mol/mL). Additional secondary endpoints included longitudinal within- and between-group comparisons of percent changes in Hb, TSAT, SI, TIBC, SF, EPO dose, and serum oxalate to assess efficacy and safety of Vit C supplementation.
Sample size estimation
In the study of Canavese and colleagues16; the mean plasma oxalate levels were 3.6 ± 0.8 mg/L and 4.5 ± 0.9 mg/L after administration of 250 and 500 mg Vit C in HD patients respectively. Based on these findings, a minimum of 20 subjects in each group were required to reject the null hypothesis at an alpha level of 0.05 and power of 90%, with the total sample size 60 subjects (20 in each group). Sample size was estimated using the NQuery statistical package, version 7.0, Los Angeles, CA.
Statistical analysis
Statistical analysis was conducted using SPSS v27 (IBM©, Chicago, IL, USA). To assess the normality of the data distribution, the Shapiro-Wilks test and histograms were performed. Mean and standard deviation (SD) were used to present quantitative parametric data, which were analyzed using the ANOVA (F) test with a Tukey post hoc test. To compare each group, quantitative non-parametric data were presented as median and interquartile range (IQR) and analyzed using the Kruskal-Wallis test and Mann-Whitney test. Qualitative variables were analyzed using the Chi-square test and presented as frequencies (%). Statistics were deemed significant when the two-tailed P value was less than 0.05. The Pearson correlation coefficient was used to calculate the correlations among variables in linear relationships between normally distributed variables, while Spearman’s rank correlation coefficient was used to calculate the correlations among variables in non-normal or non-linear monotonic relationships.