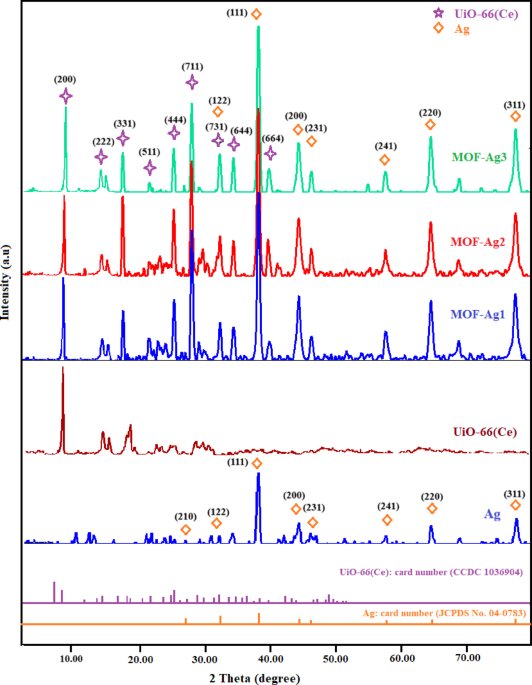
Figure 1. displays the PXRD patterns of green Ag, Ce-MOF and the MOF-Ag composites (MOF-Ag1, MOF-Ag2, and MOF-Ag3).
1 Full size image XRD chart for MOF, green silver and MOF-Ag composites (MOF-Ag1, MOF-Ag2 and MOF-Ag3).
Table 1 The crystallite size of MOF, green silver and MOF-Ag composites (MOF-Ag1, MOF-Ag2 and MOF-Ag3).
The synthesized MOF-Ag composites were shown to contain a range of particles and pore diameters in scanning electron microphotographs (SEM).
proving that MOF-Ag composites (MOF-Ag1, MOF-Ag2 and MOF-Ag3) exhibited average particle sizes of 36.7, 41.3, and 37.1 nm, respectively, confirming that the synthesized MOF-Ag composites possessed a well-defined crystalline structure.
Characterization
The MOF-Ag composites have been generated, dried, and subjected to various characterizations utilizing BET, SEM, XRD and contact angle, as mentioned in the experimental section.
PXRD analysis
The X-ray diffraction (XRD) patterns of the synthesized compounds were analyzed to investigate their crystalline structure and phase purity. Figure 1. displays the PXRD patterns of green Ag, Ce-MOF and the MOF-Ag composites (MOF-Ag1, MOF-Ag2, and MOF-Ag3). The presence of sharp and high-intensity diffraction peaks indicates the high crystallinity of the synthesized materials. The PXRD patterns of the MOF-Ag composites were compared with those of pristine Ce-MOF and Ag nanoparticles to confirm the successful formation and purity of the composites.
The characteristic diffraction peaks of Ce-MOF appeared at 2θ values of 8.5°, 14.38°, 17.9°, 21.49°, 28.78°, 29.69°, 31.96°, 34.41°, and 39.34°, corresponding to the crystallographic planes (200), (222), (331), (511), (444), (711), (731), (644), and (664), respectively. These peaks are consistent with the cubic crystal structure belonging to the Fm-3 m space group with a lattice parameter of a = 21.47 Å and agree well with CCDC card No. 1,036,90451. In addition, the diffraction peaks observed at 27.81°, 32.16°, 38.12°, 44.31°, 46.21°, 57,39°, 64.4°, and 77.5° correspond to the (210), (122), (111), (200), (231), (241), (220), and (311) planes of face-centered cubic metallic Ag nanoparticles, respectively, in agreement with JCPDS file No. 04–078360,61.
The coexistence of diffraction peaks corresponding to both Ce-MOF and metallic Ag confirms the successful incorporation of Ag nanoparticles into the MOF framework without significant structural distortion. Furthermore, the absence of additional impurity peaks indicates the high phase purity of the synthesized composites. The clear and sharp diffraction peaks further demonstrate the excellent crystallinity of the prepared powders. Jacobsen et al. (2019) reported that Ce-MOF composites exhibit sharp and intense diffraction peaks, indicating high crystallinity and phase purity of the synthesized structures62. Similarly, Zhang et al.63 confirmed the incorporation of Ag nanoparticles into MOF frameworks through the appearance of characteristic diffraction peaks corresponding to both the parent MOF and metallic Ag phases63.
The crystallite dimensions of the synthesized green Ag, Ce-MOF and MOF-Ag composites were determined utilizing the Debye–Scherrer equation, relying on the full width at half maximum (FWHM) of the most prominent diffraction peaks (Table 1). The results indicated that the crystallite sizes of green Ag, Ce-MOF, MOF-Ag1, MOF-Ag2, and MOF-Ag3 varied from 15.61 to 19.04 nm, 11.38 to 33.52 nm, 18.12 to 34.16 nm, 13.12 to 26.68 nm, and 8.29 to 27.29 nm, respectively, with average crystallite sizes of 18.75, 22.14, 21.81, 21.02, and 19.01 nm. The measured nanoscale crystallite dimensions validate the effective synthesis of nanocrystalline Ag, Ce-MOF and MOF-Ag composites. Furthermore, the comparatively diminutive crystallite sizes may enhance electrocatalytic performance by enhancing the surface-active sites and enabling charge transfer during water-splitting reaction.
Fig. 1 Full size image XRD chart for MOF, green silver and MOF-Ag composites (MOF-Ag1, MOF-Ag2 and MOF-Ag3).
Table 1 The crystallite size of MOF, green silver and MOF-Ag composites (MOF-Ag1, MOF-Ag2 and MOF-Ag3). Full size table
FTIR
The FTIR spectra of the synthesized Ce-MOF and AgNPs are presented in Fig. 2. For the Ce-MOF spectrum, the characteristic absorption band observed at 1674 cm⁻¹ can be attributed to the stretching vibration of the carbonyl group (C = O) of the organic linker coordinated with the cerium ions. The band appearing at 1280 cm⁻¹ is assigned to the C–O stretching vibration, confirming the presence of oxygen-containing functional groups within the MOF framework. In addition, the absorption peak at 727 cm⁻¹ corresponds to the metal–oxygen (Ce–O) vibration, indicating the successful formation of the cerium-based metal–organic framework structure64.
For the AgNPs spectrum, the broad absorption observed around 1000 cm⁻¹ is attributed to C–O or C–N stretching vibrations originating from biomolecules or phytochemicals acting as reducing and stabilizing agents during the green synthesis process. The peaks located at 1697 cm⁻¹ and 1572 cm⁻¹ are associated with carbonyl (C = O) and aromatic C = C stretching vibrations, respectively. These functional groups confirm the interaction of organic compounds from the plant extract with the surface of silver nanoparticles, contributing to nanoparticle stabilization and preventing aggregation65.
Overall, the FTIR results confirm the successful synthesis of both Ce-MOF and AgNPs and reveal the presence of functional groups responsible for structural stability and enhanced electrochemical behavior.
Fig. 2 Full size image FTIR chart for Ce-MOF and green silver.
SEM images
The SEM images of the produced MOF-Ag composites (MOF-Ag1, MOF-Ag2, and MOF-Ag3), shown in Fig. 3 (A, C, and E), showed the crystals are very small, in the nanometer range. As the scale bar shows, the crystals appear semi-spherical. In some areas, they appear as agglomerates or clusters of nanoparticles. In addition, the surface appears rough and covered with protruding particles distributed in a non-uniform manner. The synthesized MOF-Ag composites were shown to contain a range of particles and pore diameters in scanning electron microphotographs (SEM). To assess the distribution of particle sizes, Java 1.8.0 172 and ImageJ (1.53e) were used to generate a Gaussian mixture model and histogram. The findings are shown in Fig. 3 (B, D, and F). proving that MOF-Ag composites (MOF-Ag1, MOF-Ag2 and MOF-Ag3) exhibited average particle sizes of 36.7, 41.3, and 37.1 nm, respectively, confirming that the synthesized MOF-Ag composites possessed a well-defined crystalline structure. Li et al. reported that Ag@MOF-801 composites revealed spherical Ag nanoparticles adorning the facets of octahedral MOF-801 structures, confirming successful Ag deposition at the nanoscale66. Nikmehr et al. investigated Zn-MOF morphology and implemented histogram and Gaussian fitting to SEM-derived particle size data to extract mean particle dimensions67. Collectively, these studies validate both our morphological observations and quantitative approach especially the combined use of SEM, ImageJ, and Gaussian fitting to elucidate the nanoscale particle size distributions of MOF-Ag composites.
Fig. 3 Full size image SEM images of synthesized MOF-Ag composites (A) MOF-Ag1, (C) MOF-Ag2 and (E) MOF-Ag3 and their particle size distributions (B) MOF-Ag1, (D) MOF-Ag2 and (F) MOF-Ag3.
TEM images
The HR-TEM images of MOF‒Ag1, MOF‒Ag2, and MOF‒Ag3 Fig. 4 confirm the successful incorporation and dispersion of Ag nanoparticles within the MOF matrix. The particle size distributions were analyzed using ImageJ software (version 1.53e) based on TEM micrographs recorded at different scales68,69.
The TEM images of MOF–Ag1, MOF–Ag2, and MOF–Ag3 show the successful formation and distribution of Ag nanoparticles on/within the MOF matrix. The Ag particles appear as dark spherical or quasi-spherical nanodomains due to their higher electron density compared with the MOF support.
For MOF–Ag1 Fig. 4a, the particles are relatively dispersed but show some degree of aggregation. The measured particle sizes vary widely, approximately from 5 to 39 nm, indicating a broad particle-size distribution. This is also supported by the histogram Fig. 4g, where most particles are concentrated around 20–25 nm, but larger particles are present. The broad distribution may be attributed to partial nucleation and growth of Ag nanoparticles at different sites on the MOF surface.
For MOF–Ag2 Fig. 4b, Ag nanoparticles are more uniformly distributed, with most measured particles falling within the range of approximately 16–28 nm. The particle-size distribution Fig. 4h shows a relatively regular Gaussian-like profile, suggesting improved dispersion and more controlled nanoparticle growth compared with MOF–Ag1. The higher density of dark particles indicates increased Ag incorporation while still maintaining nanoscale particle formation.
For MOF–Ag3 Fig. 4c, the Ag nanoparticles remain well distributed, although localized clustering can be observed in some regions. The measured particle sizes are mostly in the range of about 15–25 nm, and the histogram Fig. 4i confirms that the majority of particles are centered around the mid-nanometer range. This suggests that increasing Ag content promotes the formation of more Ag nanodomains, while the MOF framework helps restrict excessive particle growth.
The SAED patterns of MOF–Ag1, MOF–Ag2, and MOF–Ag3 Fig. 4(d–f) display concentric diffraction rings with bright spots, confirming the polycrystalline nature of the Ag-containing MOF samples. The presence of ring patterns indicates that the Ag nanoparticles are crystalline and randomly oriented within the MOF matrix. The coexistence of diffuse and sharp diffraction features may be related to the contribution of the MOF framework together with crystalline Ag nanodomains.
Furthermore, the selected area electron diffraction (SAED) patterns corresponding to MOF‒Ag1, MOF‒Ag2, and MOF‒Ag3 Fig. 4 displayed distinct bright concentric rings accompanied by diffraction spots, confirming the crystalline nature and high crystallinity of the synthesized Ag-loaded MOF nanocomposites70,71. The diffraction features further verify the successful formation of nanoscale crystalline domains within the Ce-MOF framework. Overall, the TEM and SAED analyses collectively confirm the successful synthesis of nanoscale Ag/Ce-MOF composites with well-dispersed crystalline Ag nanoparticles incorporated into the MOF architecture.
Fig. 4 Full size image TEM micrographs of the prepared Ag-incorporated MOF composites: (a) MOF–Ag1, (b) MOF–Ag2, and (c) MOF–Ag3; corresponding SAED patterns of (d) MOF–Ag1, (e) MOF–Ag2, and (f) MOF–Ag3; and particle-size distribution histograms of (g) MOF–Ag1, (h) MOF–Ag2, and (i) MOF–Ag3.
BET analysis
A image of the BET was displayed in Fig. 5. N 2 adsorption was utilized to quantify the porosity and volumetric surface area of the produced MOF-Ag composites. As shown in Fig. 5, standard N 2 adsorption-desorption experiments were carried out at 77 K to investigate the pore volume, pore structure and surface area of MOF-Ag composites (MOF-Ag1, MOF-Ag2, and MOF-Ag3). After analysis, the surface areas of the BET were discovered to be 104.02, 16.29, and 16.13 m² g⁻¹, with average pore sizes of 2.54, 1.50, and 2.52 nm, and total pore volumes computed as 0.13, 0.01, and 0.02 cm³ g⁻¹ for samples MOF-Ag1, MOF-Ag2 and MOF-Ag3, respectively. According to this data, the produced nano composites (MOF-Ag1 and MOF-Ag3) are mesoporous. However, the microporous nature of (MOF-Ag2) was confirmed with a large surface area, suggesting a notable enhancement in catalytic performance because of the abundance of active sites72,73.
Fig. 5 Full size image Adsorption–desorption isotherm for synthesized MOF-Ag composites (a) MOF-Ag1, (b) MOF-Ag2 and (c) MOF-Ag3.
Contact angle
Utilizing the CA computation, the lipophilicity of the recently synthesized MOF-Ag composites (MOF-Ag1, MOF-Ag2 and MOF-Ag3) has been assessed Fig. 6. and the average CA was found to be 18.98°, 16.93°, and 14.84° for MOF-Ag1, MOF-Ag2 and MOF-Ag3, respectively. Considering that these values were much lower than 90°, the hydrophilicity of the produced materials suggested a very strong affinity for water74. As the amount of AgNPs decrease the angle decrease, so the best one that show hydrophilicity is MOF-Ag3 due to it has the smallest CA.
Fig. 6 Full size image Contact angle of MOF and MOF-Ag composites (a) MOF-Ag1, (b) MOF-Ag2 and (c) MOF-Ag3.
Water splitting applications
Cyclic voltammetry (CV) and surface acitivation
The electrochemical activity of the modified MOF-Ag electrodes (MOF-Ag1, MOF-Ag2, and MOF-Ag3) was evaluated by CV in a 1 M H 2 SO 4 solution.The modified electrodes were first triggered in the solution to produce the electrochemically active species. Therefore, in the acidic medium, the activation step was conducted within the potential range of − 0.8 to 2.4 V (vs. RHE). Figure 7 shows 10 cycles performed on modified GC/MOF-Ag electrodes in 1 M H 2 SO 4 solution at a scan rate of 100 mV s− 1. Regarding the three electrodes, two oxidation peaks were detected: a sharp one at 1.75 V (vs. RHE) and a weak one at 0.70, 0.45, and 0.42 V, respectively. However, at potentials of ‒0.05 and − 0.10 V (vs. RHE), a single reduction peak was observed, respectively, for MOF-Ag1, MOF-Ag2, and MOF-Ag3.
Fig. 7 Full size image CV of modified electrodes (a) MOF-Ag1, (b) MOF-Ag2 and (c) MOF-Ag3 in 1 M H 2 SO 4 .
Chronoamperometry (CA)
Using chronoamperometry at a steady voltage, the stability of the modified MOF and MOF–Ag electrodes for gas generation was assessed in an acidic medium. Figure 8a shows the modified electrode surface could withstand hydrogen generation at a potential of − 1 V (vs. RHE) in 1 M H₂SO₄. On the other hand, oxygen evolution was measured for five hours at a potential of 2.4 V (vs. RHE) for the four electrodes, as shown in Fig. 8b. Consequently, the electrode current remained relatively stable during the 5 h test, indicating good electrochemical durability under constant applied potential conditions. Although longer chronoamperometric measurements are generally recommended for comprehensive stability evaluation, the present study was mainly designed to investigate the effect of applying a constant potential on the electrochemical behavior of the prepared electrodes.
Fig. 8 Full size image Chronoamperogram of the modified GC/MOF and MOF-Ag (MOF-Ag1, MOF-Ag2 and MOF-Ag3) for (a) HER and (b) OER in acidic medium.
Linear sweep voltammetry (LSV)
The primary goal of this study was to explore the hydrogen evolution reaction (HER) mechanisms on surfaces modified by GC/MOF and MOF-Ag (MOF-Ag1, MOF-Ag2, and MOF-Ag3). This was achieved by conducting linear sweep voltammetry (LSV) experiments in a 1 M H₂SO₄ solution, as shown in Fig. 9a. The onset potential, which refers to the potential at which hydrogen evolution starts, was measured for each surface: MOF at ‒0.91 V, MOF-Ag1 at ‒0.74 V, MOF-Ag2 at ‒0.8 V, and MOF-Ag3 at ‒0.81 V (vs. RHE). These values indicate the voltage at which the electrochemical reaction begins, and lower (more negative) onset potentials generally correlate with better catalyst performance. The fact that MOF-Ag1 exhibits the most negative onset potential (‒0.74 V) suggests that it is the most efficient catalyst among the materials tested, requiring the least energy to initiate hydrogen evolution.
Thus, the HER process generally proceeds through the Volmer step followed by either the Heyrovsky step or the Tafel step:
$$MOF - Ag{\text{ }} + {\text{ }}H_{3} O^{ + } ~ + {\text{ }}e^{ - } ~~MOF - Ag - H{\text{ }} + {\text{ }}H_{2} O$$ (1)
$$MOF - Ag - H{\text{ }} + {\text{ }}H_{3} O^{ + } ~~ + {\text{ }}e^{ - } ~~~H_{2} + {\text{ }}H_{2} O{\text{ }} + {\text{ }}MOF - Ag$$ (2)
$$MOF - Ag - H{\text{ }} + {\text{ }}MOF - Ag - H~~H_{2} + {\text{ }}2MOF - Ag$$ (3)
The peak current density for each surface was as follows: 10 mA cm⁻² at ‒1.16 V for MOF, 10 mA cm⁻² at ‒0.88 V for MOF-Ag1, 10 mA cm⁻² at ‒0.9 V for MOF-Ag2, and 10 mA cm⁻² at ‒0.94 V for MOF-Ag3. This data reveals that MOF-Ag1 not only starts the HER process at the lowest overpotential, but also reaches the peak current at a less negative potential compared to the other surfaces, further suggesting its superior catalytic behavior. Lower overpotentials at peak currents are indicative of higher catalytic efficiency, as they imply less energy is required for the hydrogen evolution process to occur.
The exchange current densities (\(\:{j}_{0}\)) provide additional insight into the catalysts’ effectiveness. These values, representing the rate of reaction at equilibrium (where there is no net current), were measured as follows: \(\:1.36\times\:{10}^{-12}\)A cm⁻² for MOF, \(\:8.1\times\:{10}^{-11}\)A cm⁻² for MOF-Ag1, \(\:1.17\times\:{10}^{-11}\)A cm⁻² for MOF-Ag2, and \(\:6.7\times\:{10}^{-12}\)A cm⁻² for MOF-Ag3. The exchange current density is crucial in determining the catalytic activity; a higher \(\:{j}_{0}\)indicates a more active catalyst. MOF-Ag1 shows a significantly higher exchange current density compared to the others, reinforcing its superior catalytic efficiency. MOF has the lowest exchange current density, indicating a weaker catalytic performance for HER on this surface.
To better understand the kinetic behavior of the HER process, Tafel polarization curves were analyzed, as depicted in Fig. 9b. The Tafel slope provides information about the rate-limiting step in the hydrogen evolution process. A lower Tafel slope typically indicates a more efficient reaction mechanism. The Tafel slopes for each surface were calculated as 150 mV dec⁻¹ for MOF, 76 mV dec⁻¹ for MOF-Ag1, 86 mV dec⁻¹ for MOF-Ag2, and 91 mV dec⁻¹ for MOF-Ag3. MOF-Ag1 again outperforms the other surfaces, with the lowest Tafel slope, suggesting that it facilitates the HER process more efficiently, likely through a faster rate-determining step. This supports the conclusion that MOF-Ag1 is the most effective catalyst for hydrogen evolution in this study. The comparison between our HER work and other in literature is reported in Table 2.
Fig. 9 Full size image (a) LSV of GC/MOF and MOF-Ag (MOF-Ag1, MOF-Ag2 and MOF-Ag3) in 1M H 2 SO 4 for HER and (b) Tafel Plot of HER.
Table 2 Comparison between different surfaces for HER. Full size table
Figure 10a illustrates the oxygen evolution reaction (OER) observed on the GC/MOF and MOF-Ag (MOF-Ag1, MOF-Ag2, and MOF-Ag3) surfaces in the presence of a 1 M H₂SO₄ solution. The onset potentials, which indicate the voltage required to start the OER, were recorded at 2.29, 1.8, 1.9, and 2.1 V (vs. RHE) for GC/MOF, MOF-Ag1, MOF-Ag2, and MOF-Ag3, respectively. These values provide important information about the efficiency of the catalysts: lower onset potentials are generally indicative of better catalytic performance, as they signify that less energy is required to initiate the reaction. Among the tested surfaces, MOF-Ag1 exhibited the lowest onset potential (1.8 V), suggesting that it is the most efficient in facilitating the OER. This lower onset potential reflects the superior ability of MOF-Ag1 to activate the oxygen evolution process compared to the other materials.
In addition to the onset potential, the current peaks for the different surfaces were measured at potentials of 2.5 V for GC/MOF, 2.07 V for MOF-Ag1, 2.12 V for MOF-Ag2, and 2.18 V for MOF-Ag3, at a current density of 10 mA cm⁻². The current peak corresponds to the maximum current achieved during the reaction and is used as an indicator of the catalyst’s overall performance. MOF-Ag1 once again shows an advantage, reaching the current peak at the lowest overpotential (2.07 V), which suggests that it requires less energy to drive the reaction to a high current density compared to the other surfaces.
The generally accepted OER pathway can be described as follows:
$$MOF - Ag~ + {\text{ }}H_{2} O~MOF - Ag - OH_{{ads}} + {\text{ }}H^{ + } + {\text{ }}e^{ - }$$ (4)
$$MOF - Ag - OH_{{ads}} ~MOF - Ag - O_{{ads}} + {\text{ }}H^{ + } + {\text{ }}e^{ - }$$ (5)
$$MOF - Ag - OH_{{ads}} + {\text{ }}MOF - Ag - OH_{{ads}} MOF - Ag - O_{{ads}} ~ + {\text{ }}MOF - Ag{\text{ }} + {\text{ }}H_{2} O$$ (6)
$$MOF - Ag - O_{{ads}} ~ + {\text{ }}MOF - Ag - O_{{ads}} ~~~2MOF - Ag{\text{ }} + {\text{ }}O_{2}$$ (7)
The current densities for the different surfaces were measured and compared: \(\:7.2\times\:{10}^{-13}\)A cm⁻² for MOF, \(\:9.1\times\:{10}^{-12}\)A cm⁻² for MOF-Ag1, \(\:2.32\times\:{10}^{-12}\)A cm⁻² for MOF-Ag2, and \(\:3.7\times\:{10}^{-12}\)A cm⁻² for MOF-Ag3. These values reflect the surfaces’ catalytic activity for OER, with higher current densities indicating better performance. MOF-Ag1 exhibits the highest current density (\(\:9.1\times\:{10}^{-12}\) A cm⁻²), which aligns with the lower onset potential and current peak values, further confirming its superior catalytic behavior. In contrast, MOF exhibits the lowest current density, indicating relatively poor OER performance compared to the MOF-Ag-modified surfaces.
The Tafel slopes for the OER on the modified surfaces were calculated from the Tafel plots shown in Fig. 10b. The calculated Tafel slopes were 178 mV dec⁻¹ for MOF, 90 mV dec⁻¹ for MOF-Ag1, 128 mV dec⁻¹ for MOF-Ag2, and 138 mV dec⁻¹ for MOF-Ag3. The Tafel slope is a key parameter that provides insight into the reaction mechanism and the rate-determining step of the OER. Lower Tafel slopes suggest a faster reaction rate and a more efficient catalyst. MOF-Ag1 again stands out with the lowest Tafel slope of 90 mV dec⁻¹, which is indicative of a more efficient OER process. This suggests that MOF-Ag1 facilitates the reaction more effectively, possibly through a more favorable rate-determining step. On the other hand, MOF has the highest Tafel slope (178 mV dec⁻¹), indicating that its OER process is slower and less efficient compared to the MOF-Ag-modified surfaces. Table 3 includes the comparison between our OER work and other reported in literature.
Fig. 10 Full size image (a) LSV of GC/MOF and MOF-Ag (MOF-Ag1, MOF-Ag2 and MOF-Ag3) in 1 M H 2 SO 4 for OER and (b) Tafel Plot of OER.
Table 3 Comparison between different surfaces for OER. Full size table
Electrochemical impedance spectroscopy (EIS)
The hydrogen and oxygen evolution reactions at the modified GC/MOF and MOF–Ag (MOF–Ag1, MOF–Ag2, and MOF–Ag3) electrodes were investigated using EIS. As demonstrated in Fig. 9A, HER measurements were performed in 1 M H₂SO₄ at a fixed AC potential of − 0.8 V (vs. RHE) for the MOF electrode and − 1.0 V (vs. RHE) for the MOF–Ag electrodes, providing a summary of the fitting parameters in Table 4. The corresponding Nyquist plots displayed semi-circular features, indicating charge-transfer behavior. Similarly, Fig. 11b presents the Nyquist response for the same electrodes under OER conditions, measured at 2.1 V (vs. RHE). The resulting semi-circles in the Nyquist diagrams reflect the charge-transfer mechanism, and the associated fitting parameters are provided in Table 5. The goodness factors were 0.013–0.068 for HER and 0.009–0.016 for OER. The fitting circuit was added to the inset in Fig. 11.
Fig. 11 Full size image Nyquist plot of GC/MOF and MOF-Ag (MOF-Ag1, MOF-Ag2 and MOF-Ag3) for (a) HER, and (b) OER.
Table 4 Fitting parameters for HER. Full size table