Some radar wavelengths can even penetrate snow, ice, or dense tree cover to reveal details that optical images cannot.
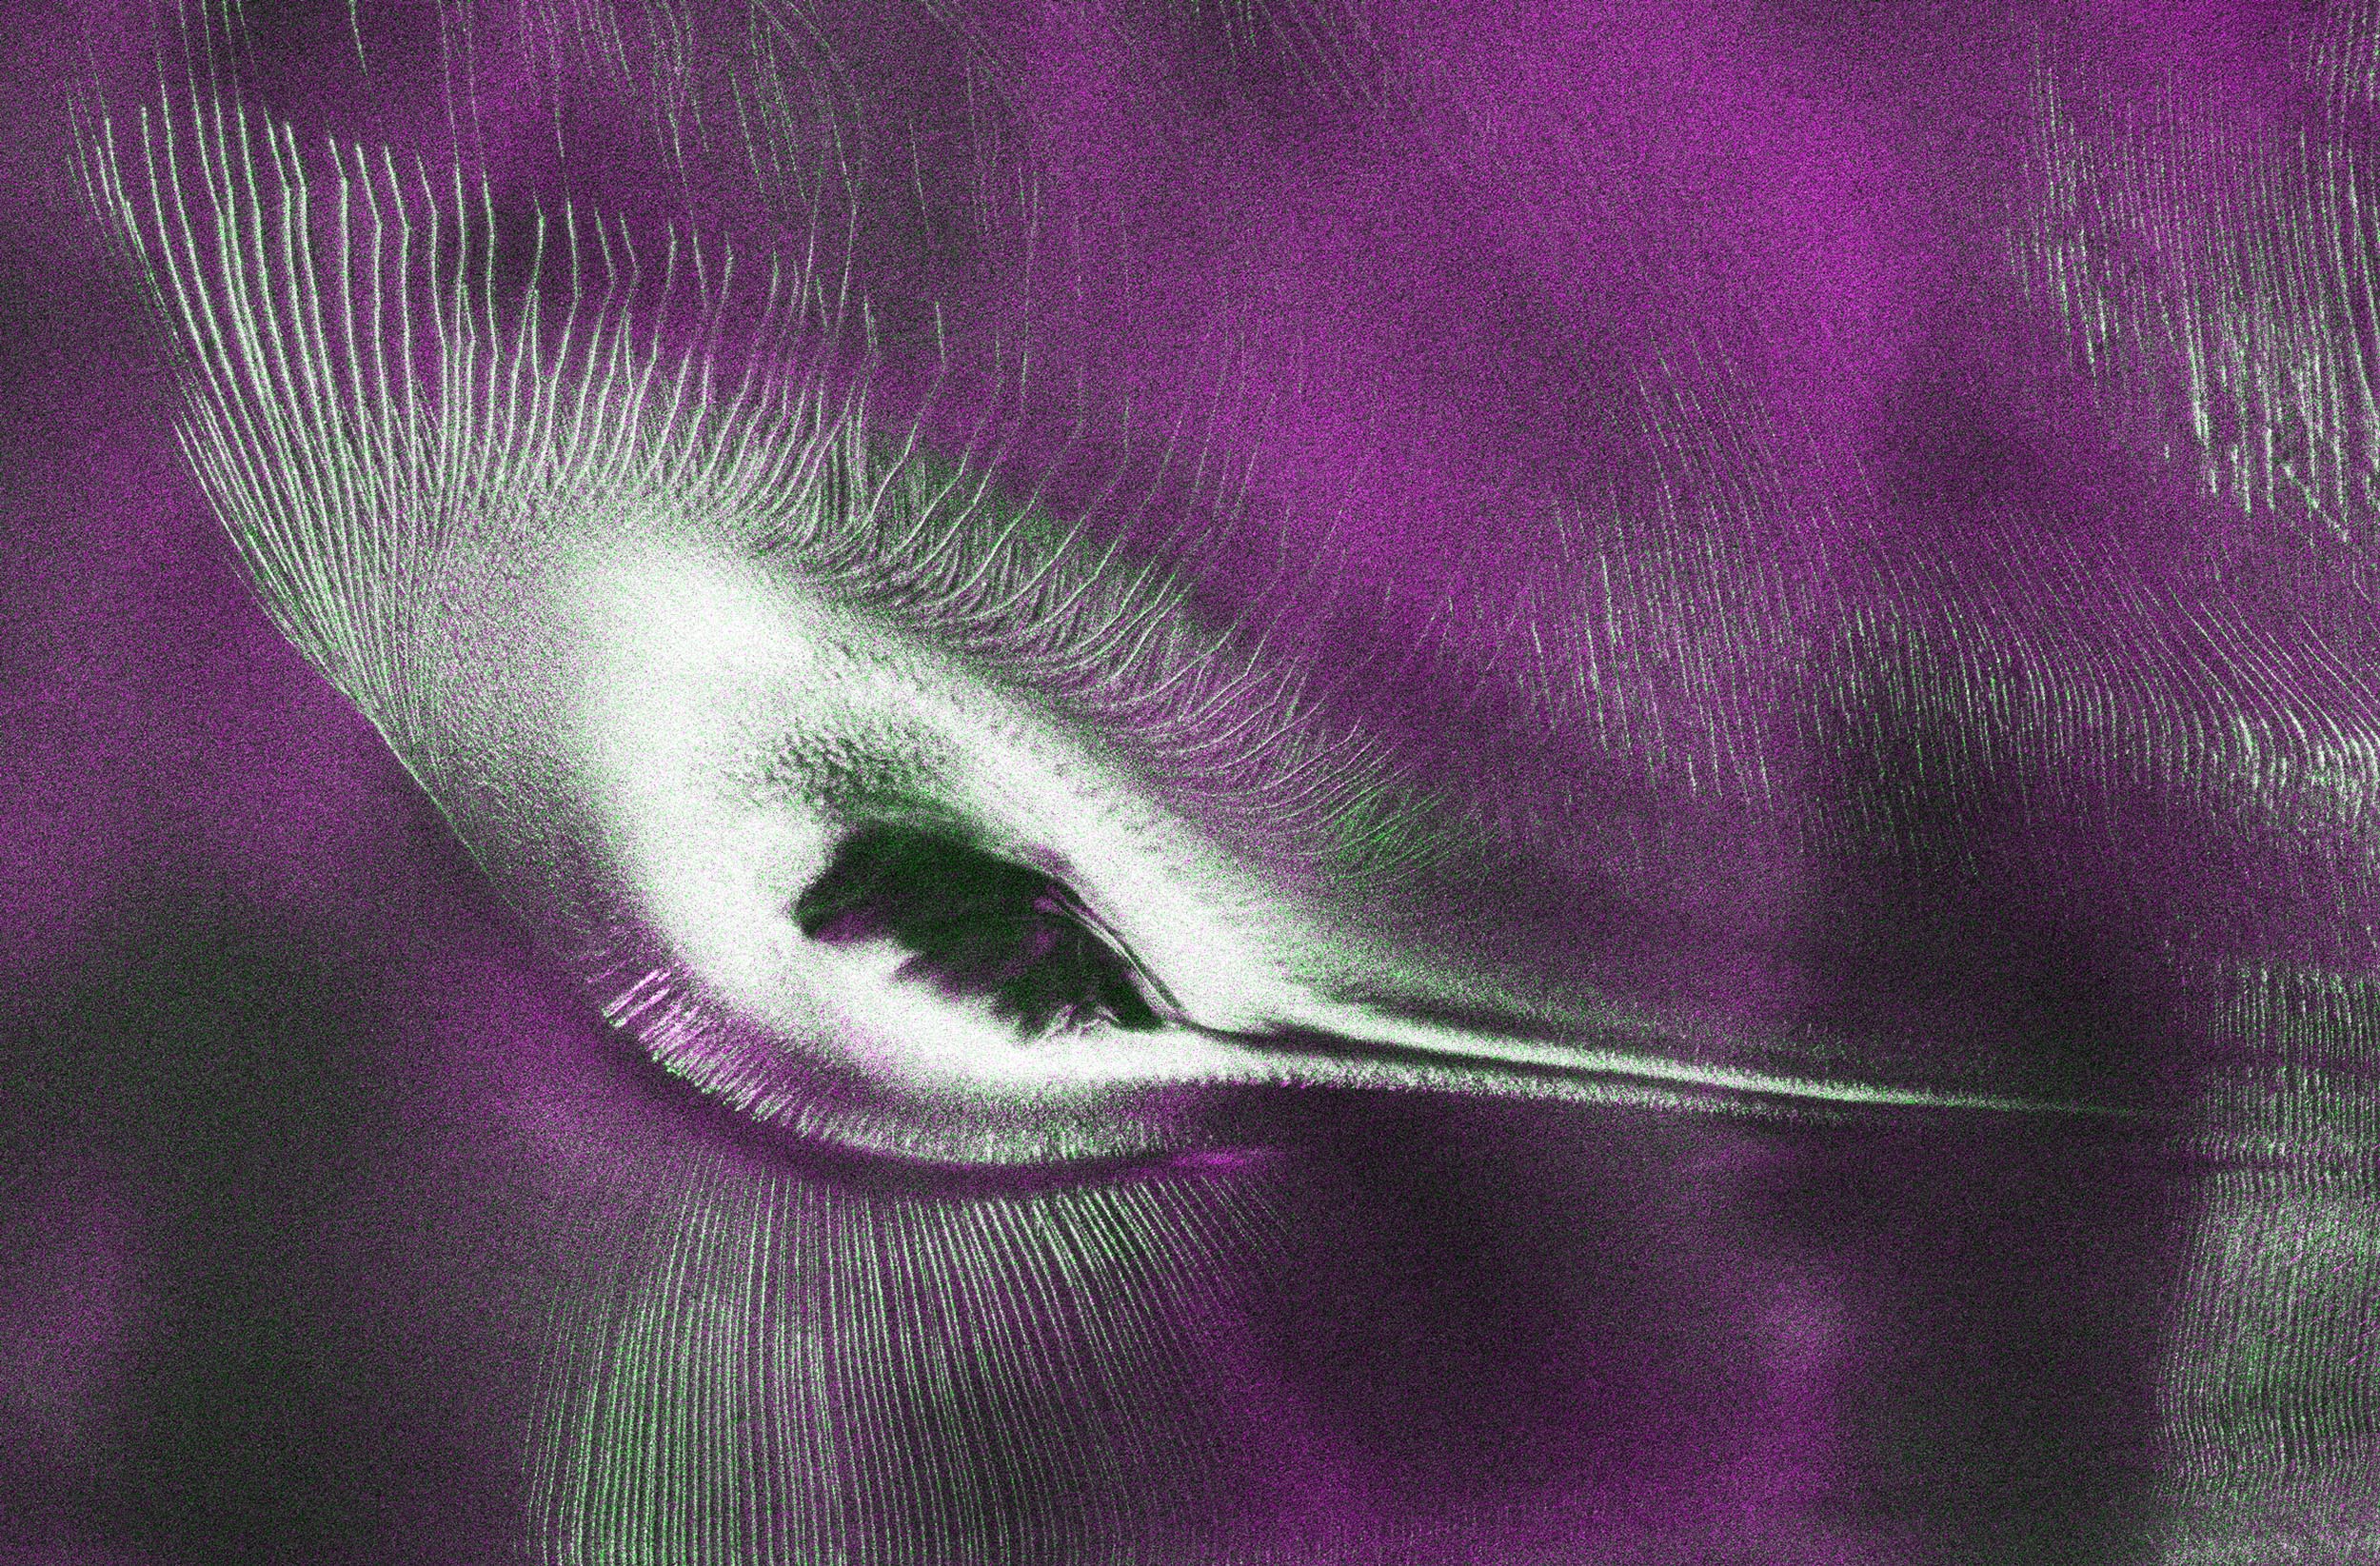
The radar image resembles a hummingbird, even though it shows a real landscape shaped by ice and rock.
NISAR image of Nunatak Zaterjavshijsja in East Antarctica is seen at center-left, surrounded by ice fractured with crevasses, which are shown as sharp, green lines.
Magenta marks areas where horizontally polarized radar signals reflected from relatively smooth surfaces, such as even ice.
Users can download NASA’s radar data through the Alaska Satellite Facility Distributed Active Archive Center in Fairbanks.
Earth is always changing. Glaciers move, forests grow and shrink, wetlands shift, and the ground itself can rise or sink after earthquakes.
Watching those changes from space helps scientists understand what is happening and respond faster when nature takes an unexpected turn.
Now, anyone can explore data from one of the most capable radar satellites ever launched.
As of July 20, 2026, the public can access information collected by the NASA-ISRO Synthetic Aperture Radar, better known as NISAR.
The mission’s two radar systems are designed to monitor Earth’s land and ice in remarkable detail, giving researchers powerful new tools to study the planet over time.
Looking beyond the surface
Radar satellites work differently from ordinary cameras. Instead of relying on sunlight, they send microwave signals toward Earth and measure the reflections that come back.
That means they can collect information day or night and, in many situations, see through clouds.
Some radar wavelengths can even penetrate snow, ice, or dense tree cover to reveal details that optical images cannot.
After nearly a year of testing, calibrating instruments, and refining data processing, the mission teams have begun releasing information from both of NISAR’s radar systems on an ongoing basis.
The satellite has already surveyed nearly every land and ice-covered part of Earth twice every 12 days.
Along the way, it has captured detailed views of cities, farmland, landslides, earthquakes, sinking ground in Mexico City, and frozen landscapes across Antarctica.
Rocky peak above a flowing glacier
One of the first public images from the mission features a mountain called Nunatak Zaterjavshijsja in East Antarctica.
The rocky peak rises above a glacier flowing northeast toward the ocean.
As the moving ice pushes around the mountain, stress builds inside the glacier, creating deep cracks known as crevasses.
The result is striking. The radar image resembles a hummingbird, even though it shows a real landscape shaped by ice and rock.
The image was created from measurements collected by NISAR’s L-band radar in August 2025 while engineers were testing the spacecraft’s systems.
NISAR image of Nunatak Zaterjavshijsja in East Antarctica is seen at center-left, surrounded by ice fractured with crevasses, which are shown as sharp, green lines. The magenta portions of the image represent more regular surfaces, such as smooth ice. Credit: NASA/JPL-Caltech. Click image to enlarge.
What the colors actually mean
The colorful image is more than just visually interesting. Every color represents the way radar signals interacted with the snow and ice.
Magenta marks areas where horizontally polarized radar signals reflected from relatively smooth surfaces, such as even ice.
Green highlights locations where the signals changed direction after partially passing through snow and ice or scattering from rough surfaces like crevasse walls. Scientists call this volume scattering.
White appears where both types of reflections are strong, suggesting a combination of surface and volume scattering.
A new look at the Antarctic landscape
In ordinary optical images, this same Antarctic landscape looks almost completely white. Only faint shadows and subtle textures hint at the mountain and the fractured ice surrounding it.
Radar reveals far more information about what is happening across the frozen surface.
Seongsu Jeong is the signal analysis engineer who produced the image at NASA’s Jet Propulsion Laboratory in Southern California (JPL).
“First, it’s a beautiful image, with rich details of features that provide insights to how the glacier is moving,” explained Jeong.
“Then, because radar can often see through snow and deep into the ice, NISAR can observe fundamentally different properties of Antarctic ice than can be seen in optical imagery. With NISAR we’re seeing what’s hidden beneath the surface.”
Two radar systems working together
NISAR is the first free-flying satellite mission to carry both an L-band radar and an S-band radar.
Each serves a different purpose because the radar wavelengths are different.
The longer L-band wavelength can pass through tree canopies, allowing scientists to study the ground beneath forests.
The S-band radar is especially useful for observing the canopies themselves, depending on leaf size and vegetation structure.
Combining both sets of observations gives researchers a more complete picture of changing ecosystems, including forests and wetlands, while also improving studies of glaciers, earthquakes, landslides, and shifting landscapes.
A growing stream of information
The Indian science team at the Indian Space Research Organisation’s Space Applications Centre in Ahmedabad has already started releasing S-band data through the Bhoonidhi portal.
On the U.S. side, calibrated L-band products have been released continuously since July 20 for measurements collected beginning on June 17, 2026.
Earlier releases included about 25 sample products in January and thousands of pre-calibrated products in February.
By the end of the year, the mission team expects to make all earlier science-operation data available.
Users can download NASA’s radar data through the Alaska Satellite Facility Distributed Active Archive Center in Fairbanks.
A record of Earth’s changing surface
The amount of information is enormous. NISAR produces science data on the order of dozens of terabytes every day as it repeatedly scans nearly all of Earth’s land and ice.
Its coverage stretches from within a few degrees of the South Pole to 77.5 degrees north latitude, reaching well above the Arctic Circle.
As NASA and the Indian Space Research Organisation approach the first anniversary of NISAR’s July 30, 2025, launch from the Satish Dhawan Space Centre in India, the satellite is already transforming how scientists track Earth’s changing surface.
Its observations are building one of the most detailed records ever assembled of seasonal and year-to-year changes across the planet.
—–
Like what you read? Subscribe to our newsletter for engaging articles, exclusive content, and the latest updates.
Check us out on EarthSnap, a free app brought to you by Eric Ralls and Earth.com.
—–