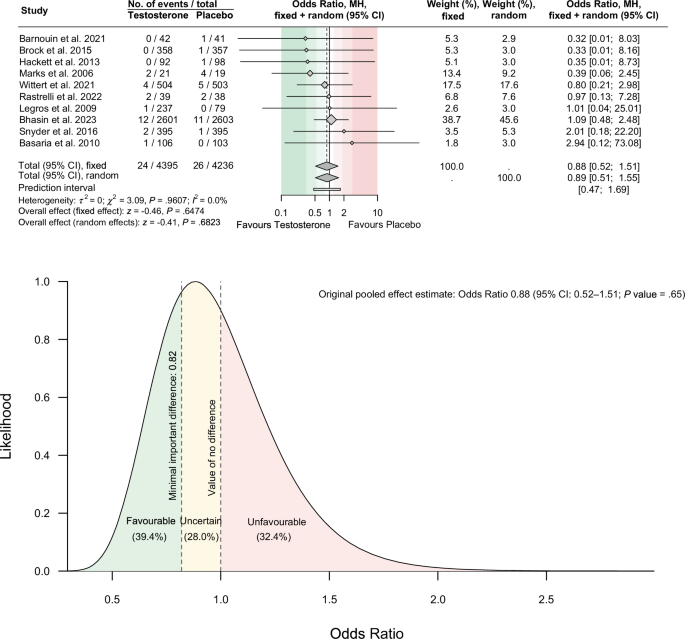
A recent meta-analysis of randomised clinical trials published in the journal examined the safety of testosterone therapy in men with hypogonadism [1].
The pooled effect estimates crossed the line of no difference and were interpreted as statistically nonsignificant, supporting the short- to mid-term safety of testosterone therapy.
The meta-analyses were replicated according to the authors’ disclosed methodologies, with estimates cross-checked to two decimal places to confirm accuracy.
The primary likelihood ratio analysis compared evidential support for a small protective effect (odds ratio 0.82) against no effect (odds ratio 1.00).
Sensitivity analyses examined a moderate protective threshold (odds ratio 0.54) and thresholds in the harmful direction (odds ratios 1.22 and 1.86), corresponding to the reciprocals of the small and moderate effect sizes, respectively [6].
A recent meta-analysis of randomised clinical trials published in the journal examined the safety of testosterone therapy in men with hypogonadism [1]. The pooled effect estimates crossed the line of no difference and were interpreted as statistically nonsignificant, supporting the short- to mid-term safety of testosterone therapy. In this commentary, those estimates are re-examined using three complementary methodologies to determine whether approaches other than conventional hypothesis testing yield additional insights.
The meta-analyses were replicated according to the authors’ disclosed methodologies, with estimates cross-checked to two decimal places to confirm accuracy. Three complementary methods were then applied. The first was the reverse fragility index, a post-hoc descriptive measure of the number of events that would need to be changed to non-events, or vice versa, to render a nonsignificant result significant [2]. Dividing this value by the total sample size yields the reverse fragility quotient, a standardised metric in which higher values indicate more robust effects and lower values indicate fragility [3]. The second was the likelihood ratio, rooted in the evidential paradigm of statistics, which quantifies the relative evidential support for one hypothesis over another given the observed data, and can distinguish between evidence favouring a hypothesis and inconclusive evidence [4]; a likelihood ratio of 8 or greater indicates at least moderate evidence, and a 1/8 likelihood interval encompasses all parameter values for which the maximum likelihood estimate provides no more than 8 times the evidential support [5]. The third was the area under the likelihood curve, which partitions the evidential weight of an estimate across favourable, uncertain, and unfavourable regions relative to a predefined minimal important difference, under the assumption of a normally distributed likelihood function, consistent with the random-effects model commonly used in meta-analysis. For pragmatic purposes, odds ratios of 0.82, 0.54, and 0.33, corresponding to small, moderate, and large effect sizes [6], were used to define meaningful thresholds in forest plots, the area under the likelihood curve, and the likelihood ratio analysis. The primary likelihood ratio analysis compared evidential support for a small protective effect (odds ratio 0.82) against no effect (odds ratio 1.00). Sensitivity analyses examined a moderate protective threshold (odds ratio 0.54) and thresholds in the harmful direction (odds ratios 1.22 and 1.86), corresponding to the reciprocals of the small and moderate effect sizes, respectively [6]. All analyses were conducted with the meta package (version 8.3-0) [7] in R (version 4.6.0; R Core Team, Vienna, Austria) using RStudio (version 2026.05.0; Posit Software, PBC, Boston, MA). Interpretation followed proposed benchmarks [8, 9].